PV data comparison
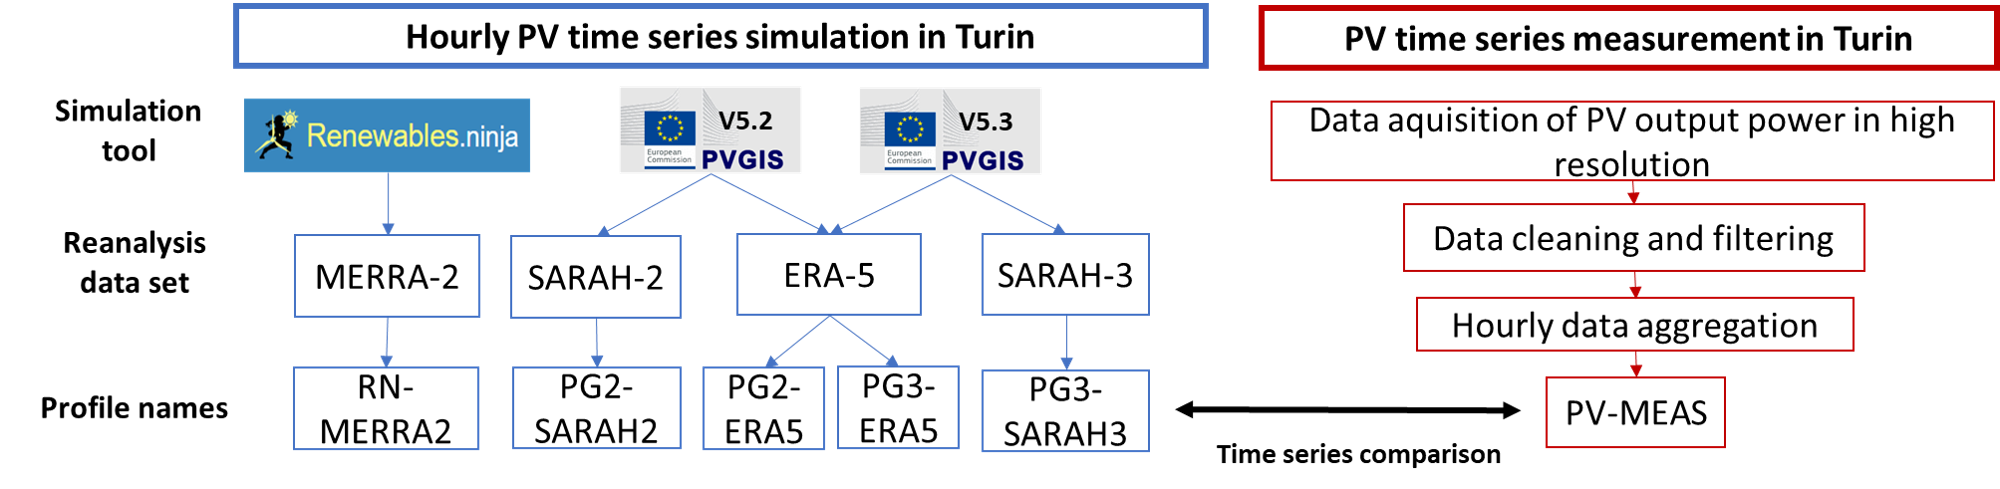
Overview
These functions automate the creation of PV performance plots, including:
Capacity factor time-series comparisons (
generate_PV_timeseries_plots())Scatter plots between measured and simulated data (
generate_PV_timeseries_plots())Error metrics (mean difference, MAE, RMSE) (
generate_PV_timeseries_plots())High-resolution plots for clear and cloudy sky conditions (
generate_high_res_PV_plots())
All results are automatically saved in:
results/{location_name}/Time series analysis results/
The functions automatically create missing output directories.
If data for the specified year is unavailable, the functions skip plotting.
All plot aesthetics (colors, linestyles, widths) are managed and can be changed in the style_config module.
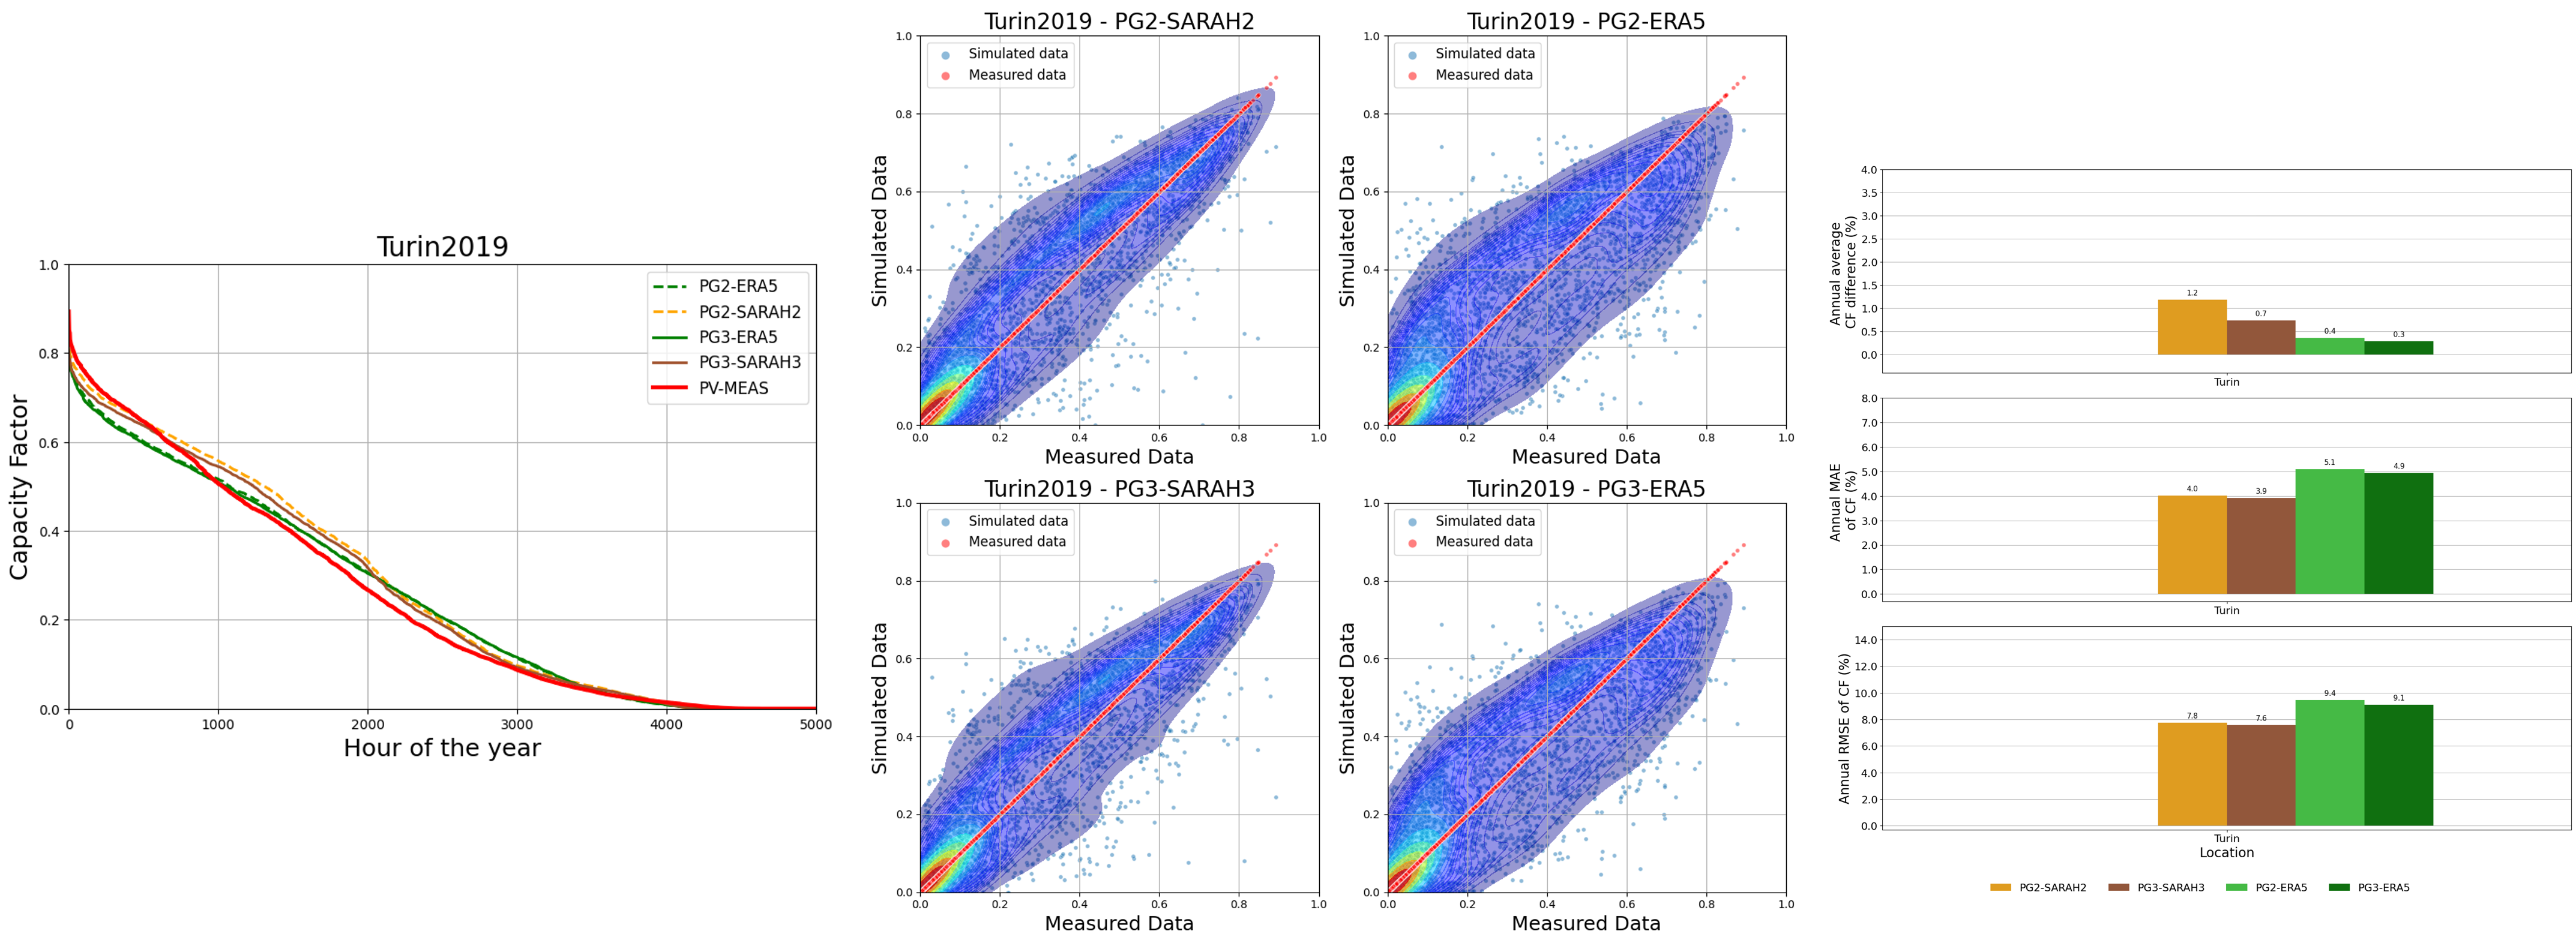
Timeseries analysis plots
The function generate_PV_timeseries_plots() generates standard PV time-series comparison plots between measured and simulated datasets:
Capacity factor time-series plots
Scatter comparison plots
Error metrics bar charts (mean difference, MAE, RMSE)
Parameters:
Name |
Type |
Description |
|---|---|---|
data_sim_meas |
pandas.DataFrame |
Contains measured ( |
location_name |
str |
Location name (e.g., “Turin”). |
year |
str |
Year of the analyzed dataset. |
output_root |
str, optional |
Root directory for results (default: “results”). |
Example:
from simeasren import generate_PV_timeseries_plots, prepare_pv_data_for_plots
df, _, _ = prepare_pv_data_for_plots("Turin", "2019")
generate_PV_timeseries_plots(df, "Turin", "2019")
Output:
*_Capacity_Factors.png*_scatterplot.png*_Errors_Analysis.png
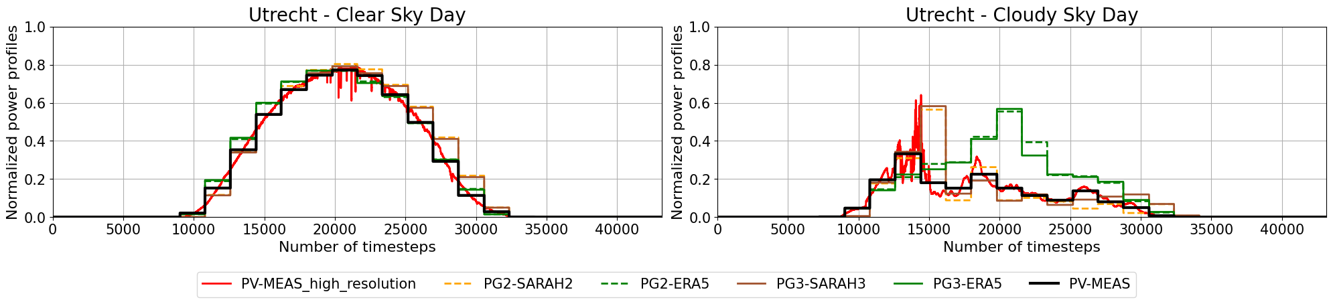
Plot high resolution PV data
The function generate_high_res_PV_plots() reates high-resolution PV plots for clear-sky and cloudy-sky conditions.
Parameters:
Name |
Type |
Description |
|---|---|---|
clear_sky_df |
pandas.DataFrame |
High-frequency PV data for clear-sky days. |
cloudy_sky_df |
pandas.DataFrame |
High-frequency PV data for cloudy-sky days. |
location_name |
str |
Location name (e.g., “Almeria”). |
year |
str |
Year of data. |
output_root |
str, optional |
Root directory for output (default: “results”). |
Example:
from simeasren import generate_high_res_PV_plots, prepare_pv_data_for_plots
_, clear_df, cloudy_df = prepare_pv_data_for_plots("Utrecht", "2017")
generate_high_res_PV_plots(clear_df, cloudy_df, "Utrecht", "2017")
Output:
*_highres_clear_vs_cloudy.png
Generate all plots
generate_PV_plots()calls both generate_PV_timeseries_plots() and generate_high_res_PV_plots() for a complete analysis in a single step and creates:
All time-series comparison plots (capacity factor, scatter, error metrics)
High-resolution plots for clear and cloudy conditions
Parameters:
Name |
Type |
Description |
|---|---|---|
data_sim_meas |
pandas.DataFrame |
Measured and simulated PV time-series data. |
clear_sky_df |
pandas.DataFrame |
High-resolution clear-sky PV data. |
cloudy_sky_df |
pandas.DataFrame |
High-resolution cloudy-sky PV data. |
location_name |
str |
Location name (e.g., “Utrecht”). |
year |
str |
Year of analysis. |
output_root |
str, optional |
Output directory (default: “results”). |
Example:
from simeasren import generate_PV_plots, prepare_pv_data_for_plots
data_sim_meas, clear_df, cloudy_df = prepare_pv_data_for_plots("Almeria", "2023")
generate_PV_plots(data_sim_meas, clear_df, cloudy_df, "Almeria", "2023")
Generated files:
Almeria2023_Capacity_Factors.pngAlmeria2023_scatterplot.pngAlmeria2023_Errors_Analysis.pngAlmeria_highres_clear_vs_cloudy.png